

Most therapists open SimplePractice to schedule appointments and write notes. The reports section often goes untouched for weeks at a time — or only gets opened when something has already gone wrong.
That’s backwards. SimplePractice reports aren’t just a way to review what happened. They’re how you catch problems before they cost you money.
In my billing work with therapy practices, the practices with the healthiest revenue cycles share one habit: they look at the same handful of reports on a consistent schedule. Not every report in the system. Not a two-hour monthly deep dive. A short, focused weekly review of the reports that tell them the most about what’s moving, what’s stuck, and what needs attention this week.
This guide covers the seven reports I consider most essential, what to actually look for in each one, what the red flags mean, and what to do about them. I’ve also included the review schedule I’d recommend for a solo practice and a simple weekly check-in routine that takes 20 to 30 minutes.
Quick answer: If you are short on time, the four SimplePractice reports to check this week are the Insurance Claims Report, Accounts Receivable (A/R) Report, Outstanding Client Balances Report, and Payment Report. Together they show you what’s unresolved, how long it’s been unresolved, and whether revenue is arriving as expected. The Appointment Report, Insurance Payment Summary, and Monthly Revenue Trends are best reviewed monthly. Full breakdown of each below.
Why Reports Matter More Than You Think
There’s a common assumption in private practice that if money is hitting your bank account, everything must be working. I understand the logic — you’re busy, clients are coming in, the EFT deposits look normal. What’s left to monitor?
Quite a bit, as it turns out.
Insurance claims can sit in a “submitted” status for weeks before anyone notices they’ve stalled. Clients accumulate balances that quietly grow from $30 to $300 without a statement ever going out. Payments get posted to the wrong account. Payer reimbursement rates shift. Denials repeat themselves because no one identified the pattern.
None of these things announce themselves. They accumulate in the background until the revenue impact is significant enough to be obvious — and by then, some of it may be unrecoverable.
Consistent report review is the practice habit that prevents all of this. It doesn’t take long. It just has to happen regularly enough to catch things while there’s still time to act.
SimplePractice Report 1: Insurance Claims Report — Review weekly
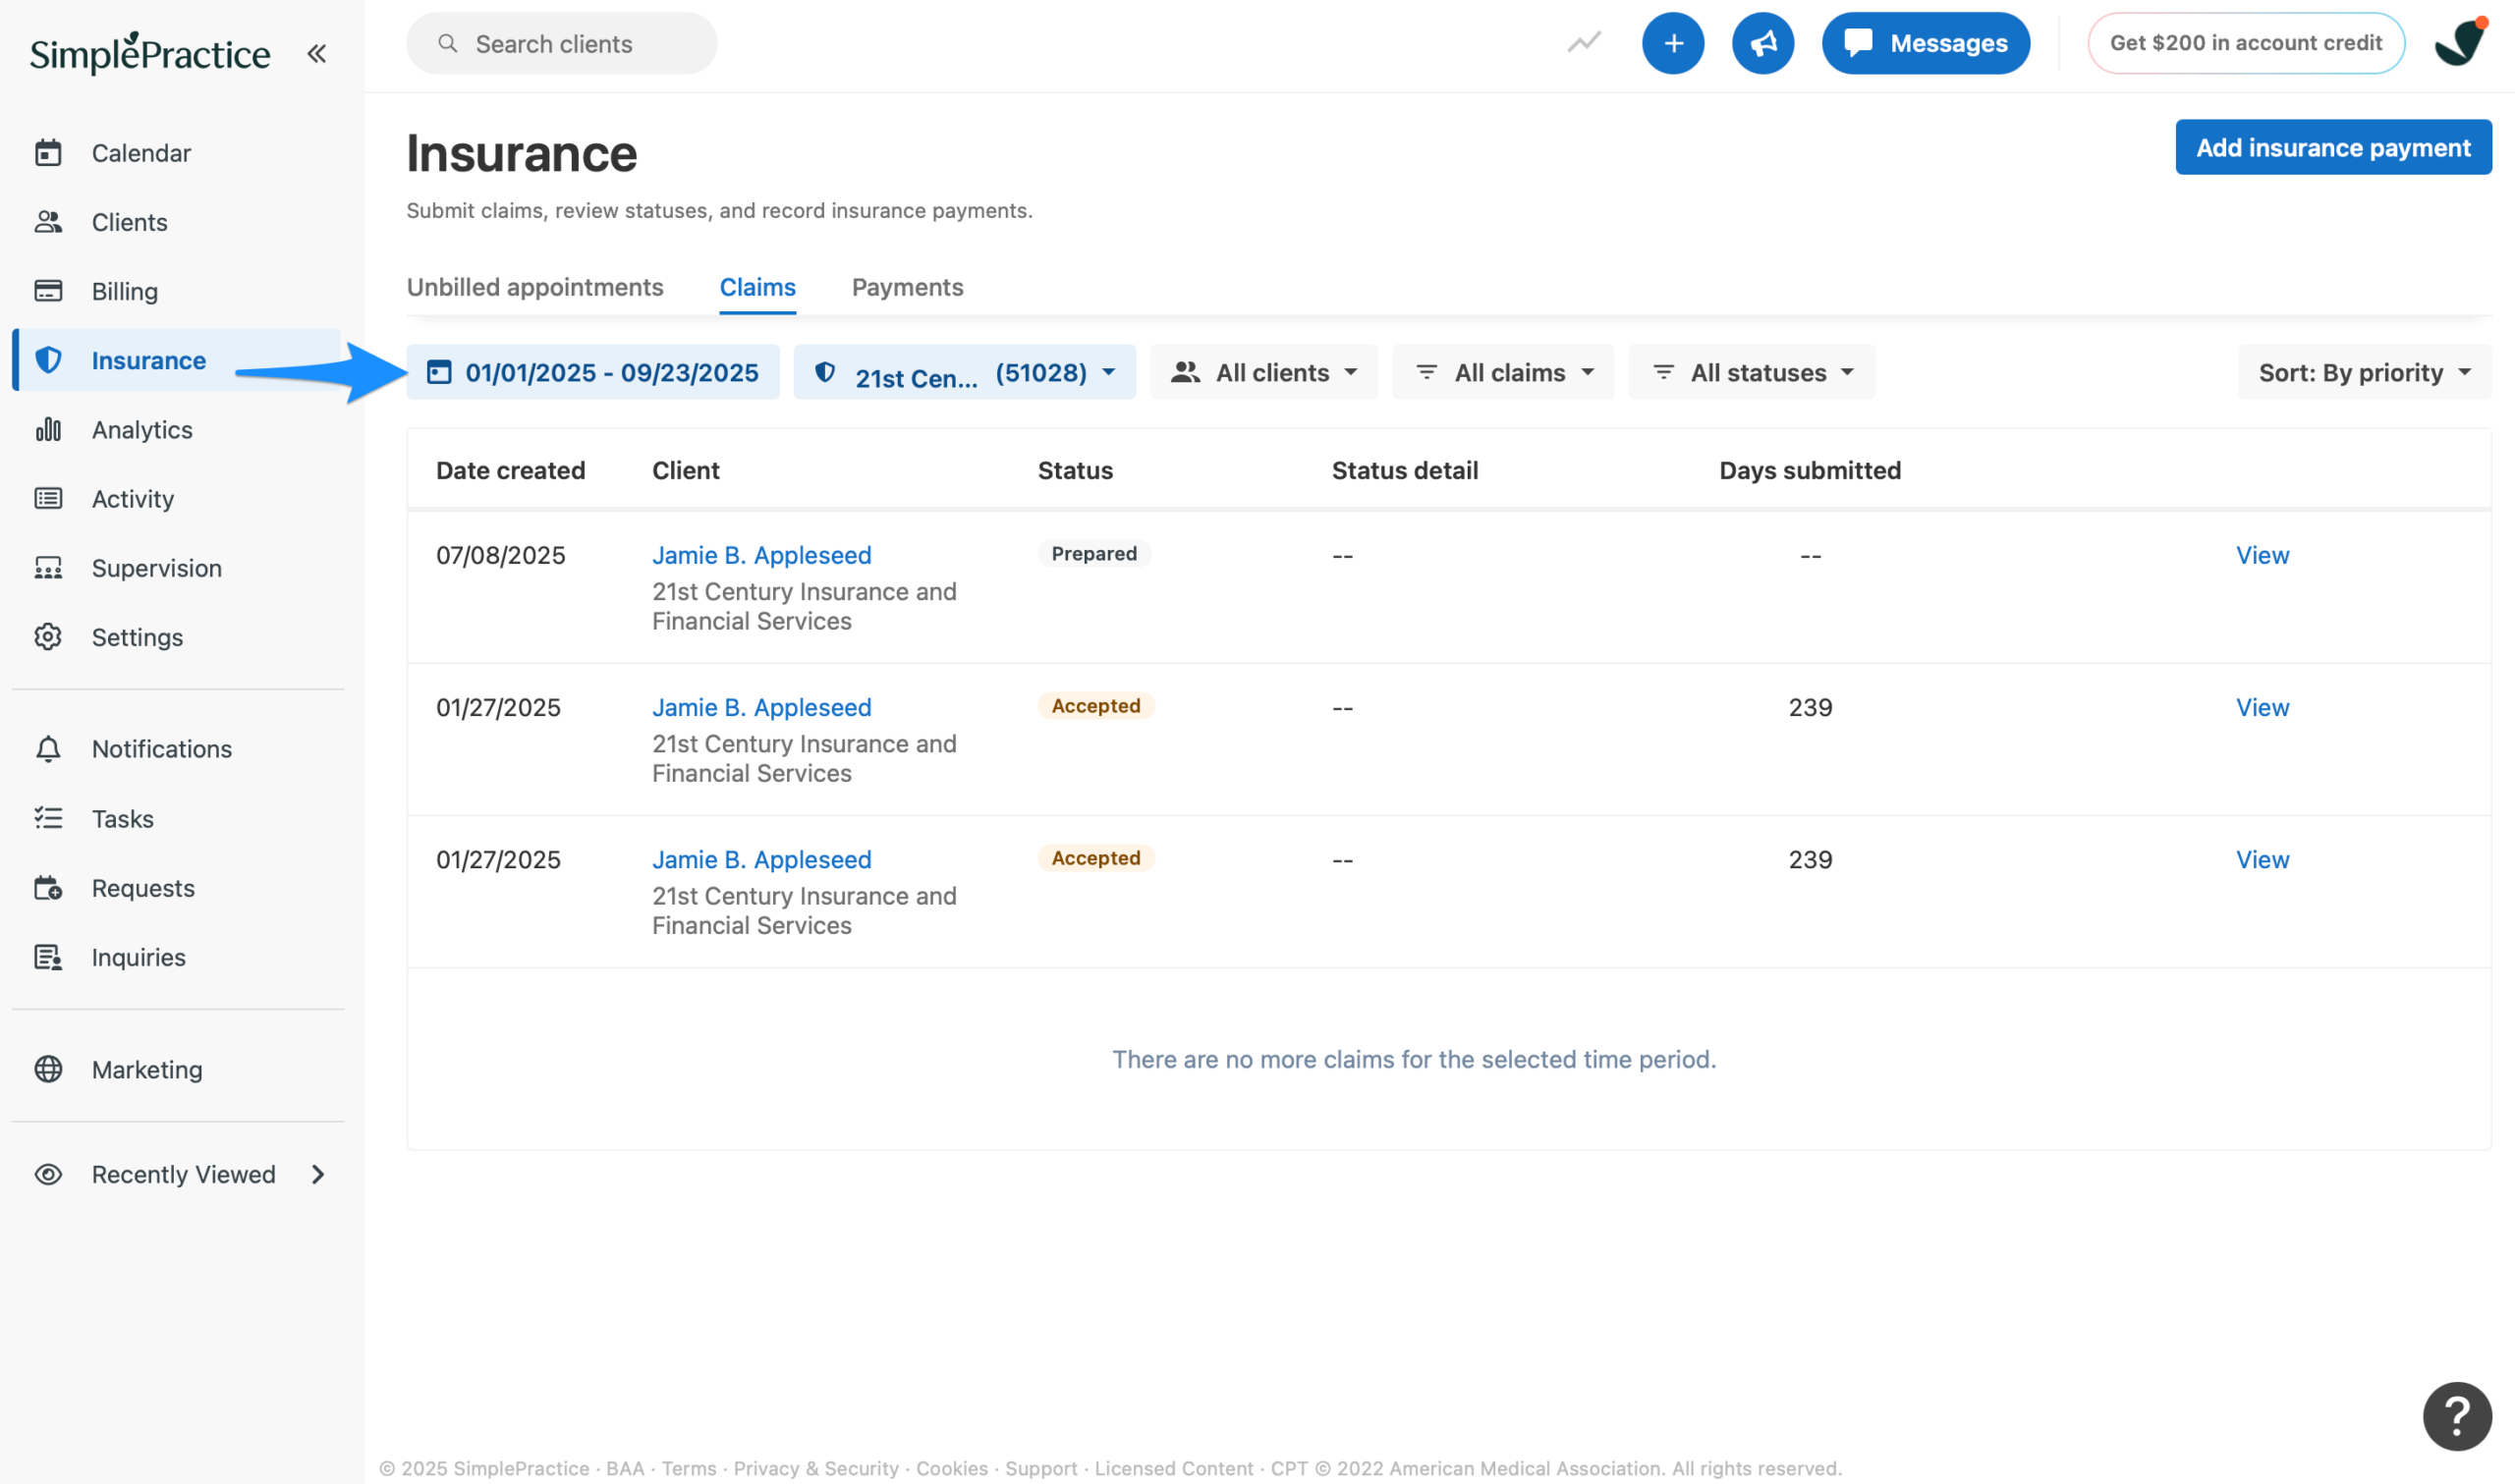
If I could only look at one report every week, this is the one. The Insurance Claims Report shows you the status of every claim you’ve submitted — what’s been paid, what’s pending, what’s been denied, and what’s been rejected. It’s the most direct view into where your insurance revenue stands.
Find this one under Billing > Claims
What to Look For
- Claims in “Submitted” status older than 30 days — these should have generated a response by now
- Claims in “Denied” or “Rejected” status that haven’t been worked
- The same denial reason appearing on multiple claims — a pattern worth investigating
- Claims for dates of service approaching the timely filing window for any payer
- Claims that have been resubmitted but haven’t generated a new response
What the Statuses Actually Mean
Submitted means the claim left your system. It does not mean the payer received it or is processing it. If a claim has been “submitted” for more than two weeks with no update, check payer portal status or call.
Denied means the claim was received and reviewed but not approved for payment. The denial reason code on the EOB tells you why. Every denied claim needs a response — either a corrected resubmission or a formal appeal — before the response deadline passes.
Rejected means the claim never made it into the payer’s system. There was a data error — invalid NPI, wrong date of birth, missing field — that caused it to be returned. Fix the error and resubmit promptly.
Pending means the payer received the claim and it’s in process, or they’ve requested additional information. If a claim has been pending for more than 30 days, follow up.
⚠️ If you see multiple denials from the same payer for the same reason, don’t just work them individually. Investigate the root cause. A pattern of “modifier missing” denials, for example, means something in your claim setup needs to be fixed — not just corrected claim by claim.
Report 2: Accounts Receivable (A/R) Report — Review weekly
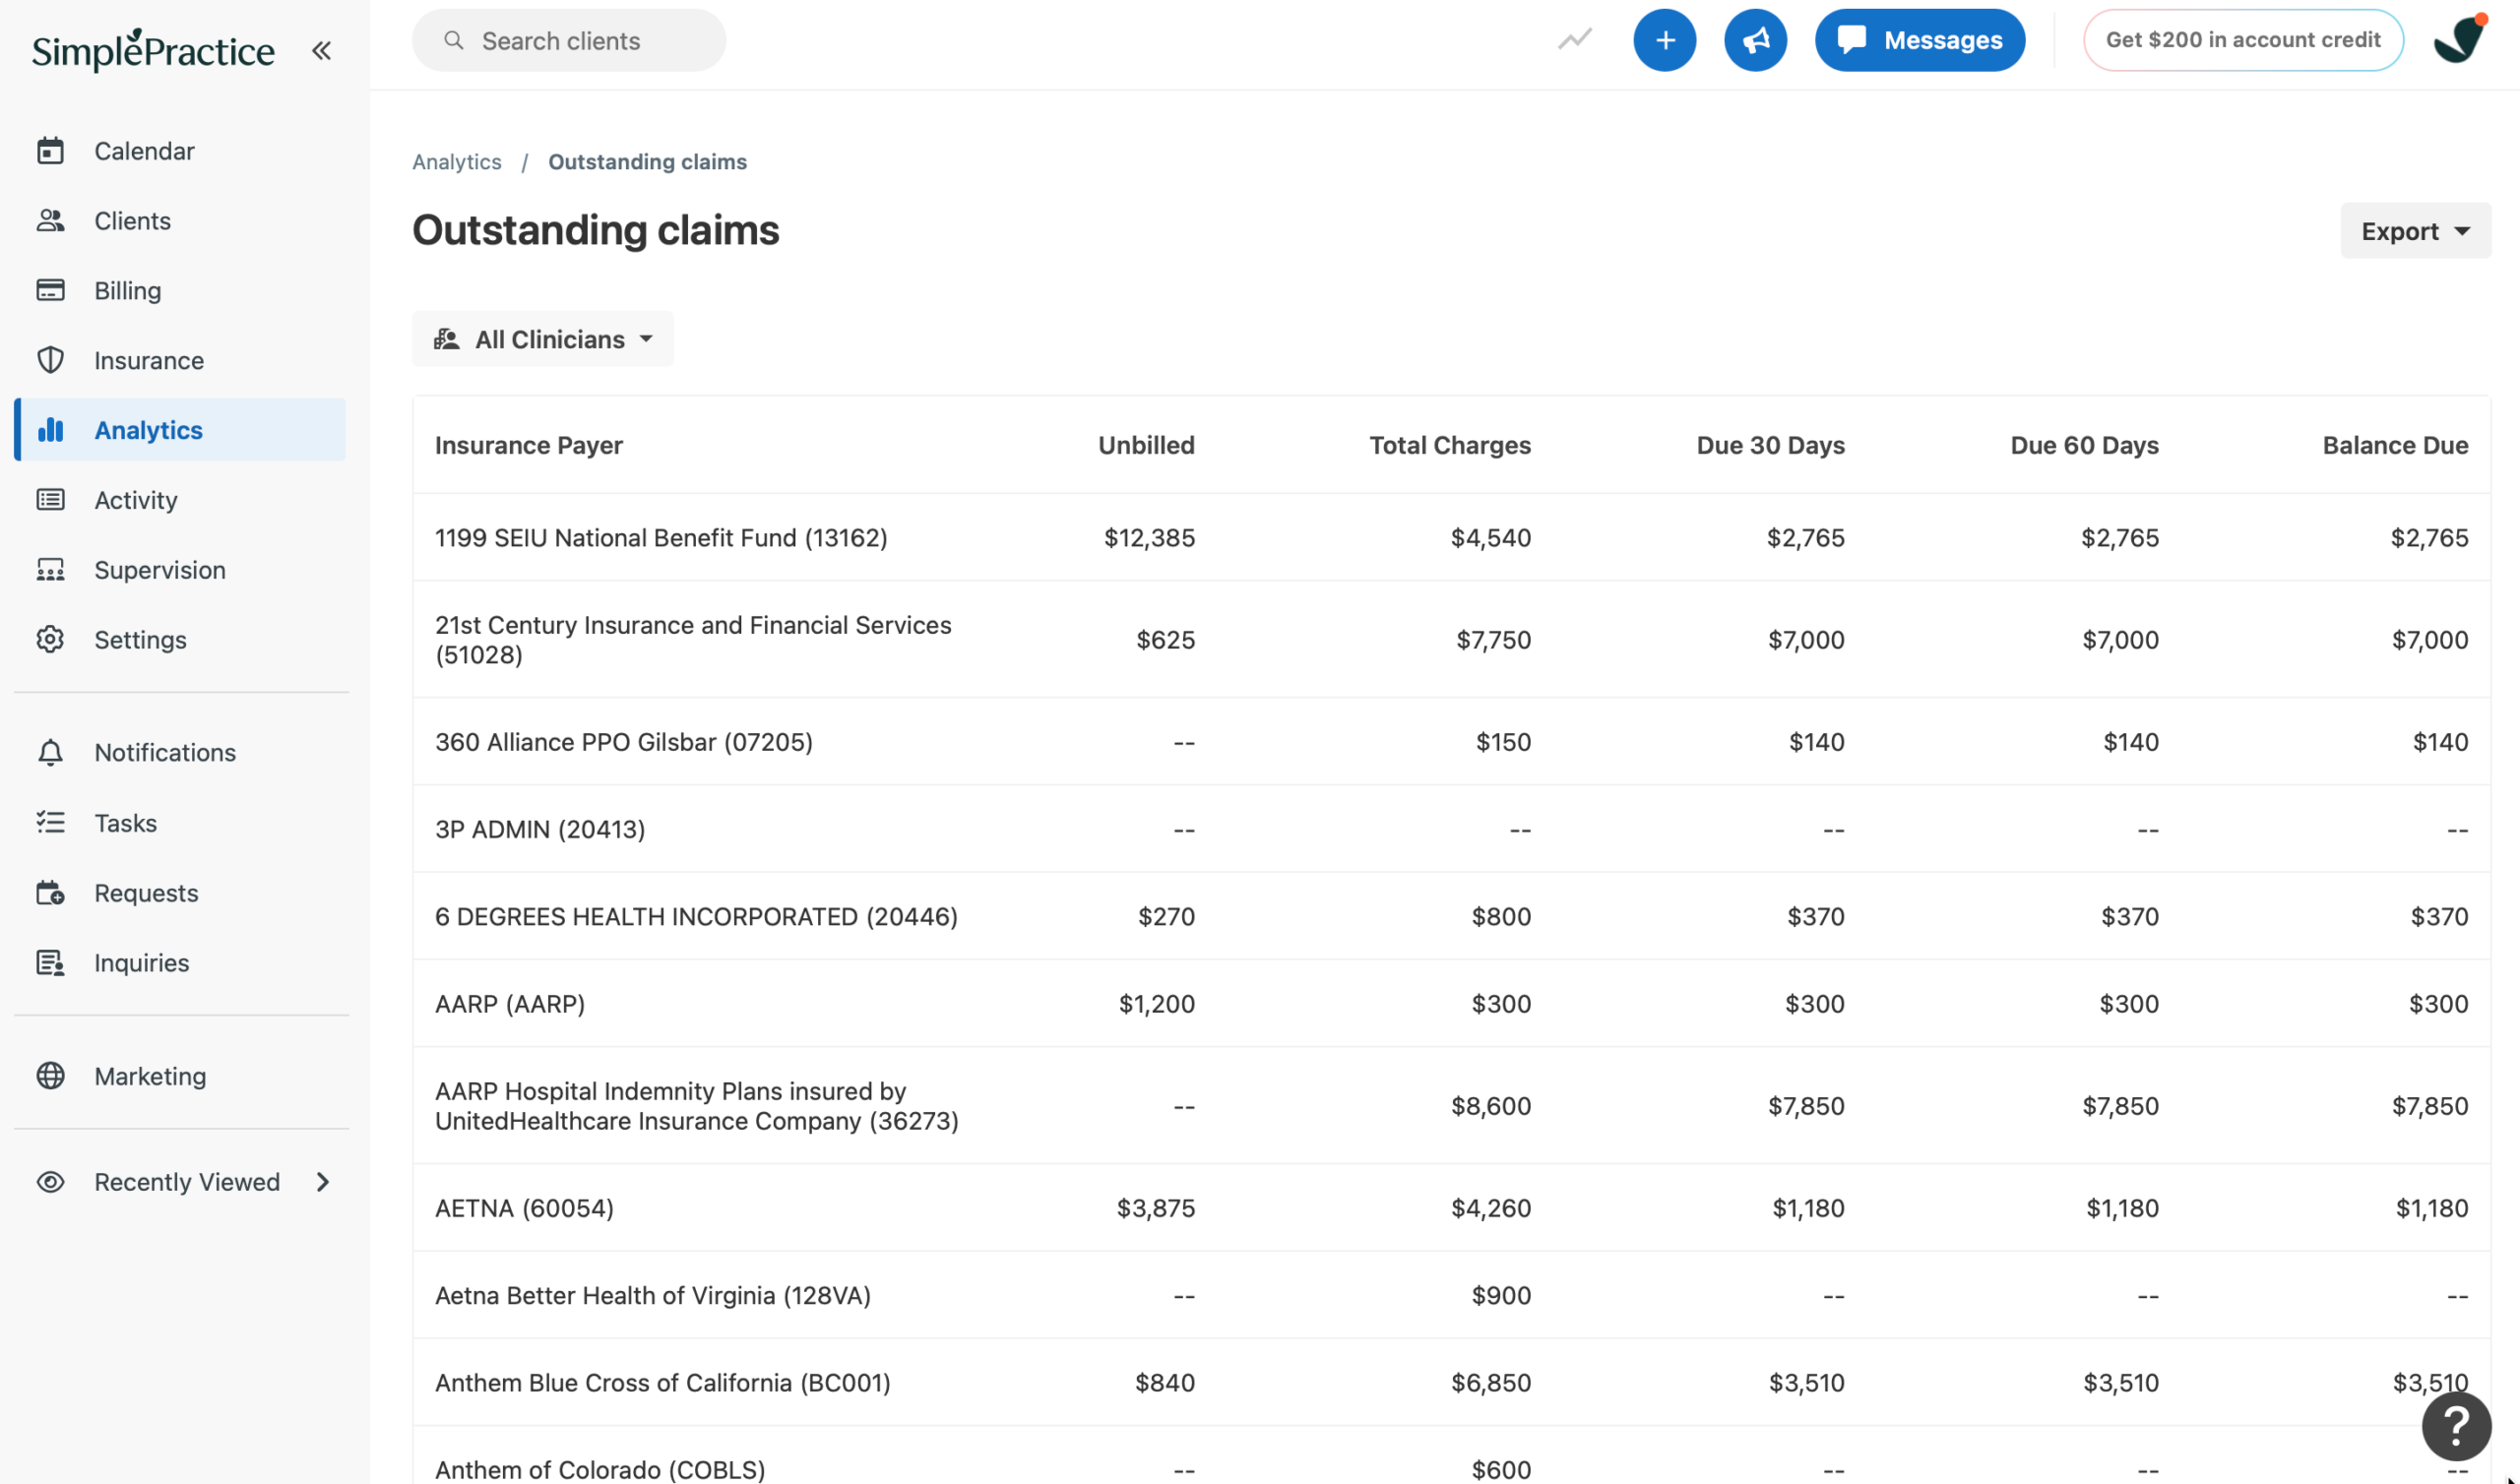
The A/R report answers the most fundamental question in billing: who owes you money, and how long have they owed it? It shows unpaid balances from both insurance companies and clients, organized by how old each balance is.
This is your aging report — the same one I described in the mental health billing guide as one of the most valuable and most ignored reports in private practice. The aging buckets tell a story about the health of your revenue cycle.
Understanding the Aging Buckets
| Age Bucket | What It Means | What to Do |
| 0–30 days | Normal. Claims in process. | Monitor. No action needed unless specific claims are flagged. |
| 31–60 days | Worth a look. Most clean claims resolve in 30 days. | Check status on anything that should have paid by now. Verify no hidden rejections. |
| 61–90 days | Needs follow-up. Something is wrong. | Call the payer or check the portal. Document what you find. Every claim in this bucket needs a status. |
| 91–120 days | Active problem. High risk. | Investigate immediately. Check timely filing limits. Determine whether the claim is appealable. |
| 120+ days | Critical. Approaching or past appeal windows. | Urgent action required. Some of this may be unrecoverable. Determine write-off vs. last-attempt appeal for each. |
A healthy A/R report has most of its balance in the 0–30 day bucket. As balances shift into the 60+ day range, the probability of collection drops. By 120 days, some payers’ appeal windows have closed, and what was once collectible revenue becomes a write-off.
The goal isn’t to eliminate aging balances entirely — some delay is inevitable. The goal is to make sure nothing ages past 60 days without someone knowing about it and taking action.
⚠️ If your 90+ day bucket is growing month over month, that’s a revenue cycle problem that won’t self-correct. It needs active follow-up — either from you or from a biller.
✔️ Filter the A/R report to show only balances over 60 days. Work through that list first. Add a note to each account with the date you followed up and what you were told.
Report 3: Outstanding Client Balances Report — Review weekly
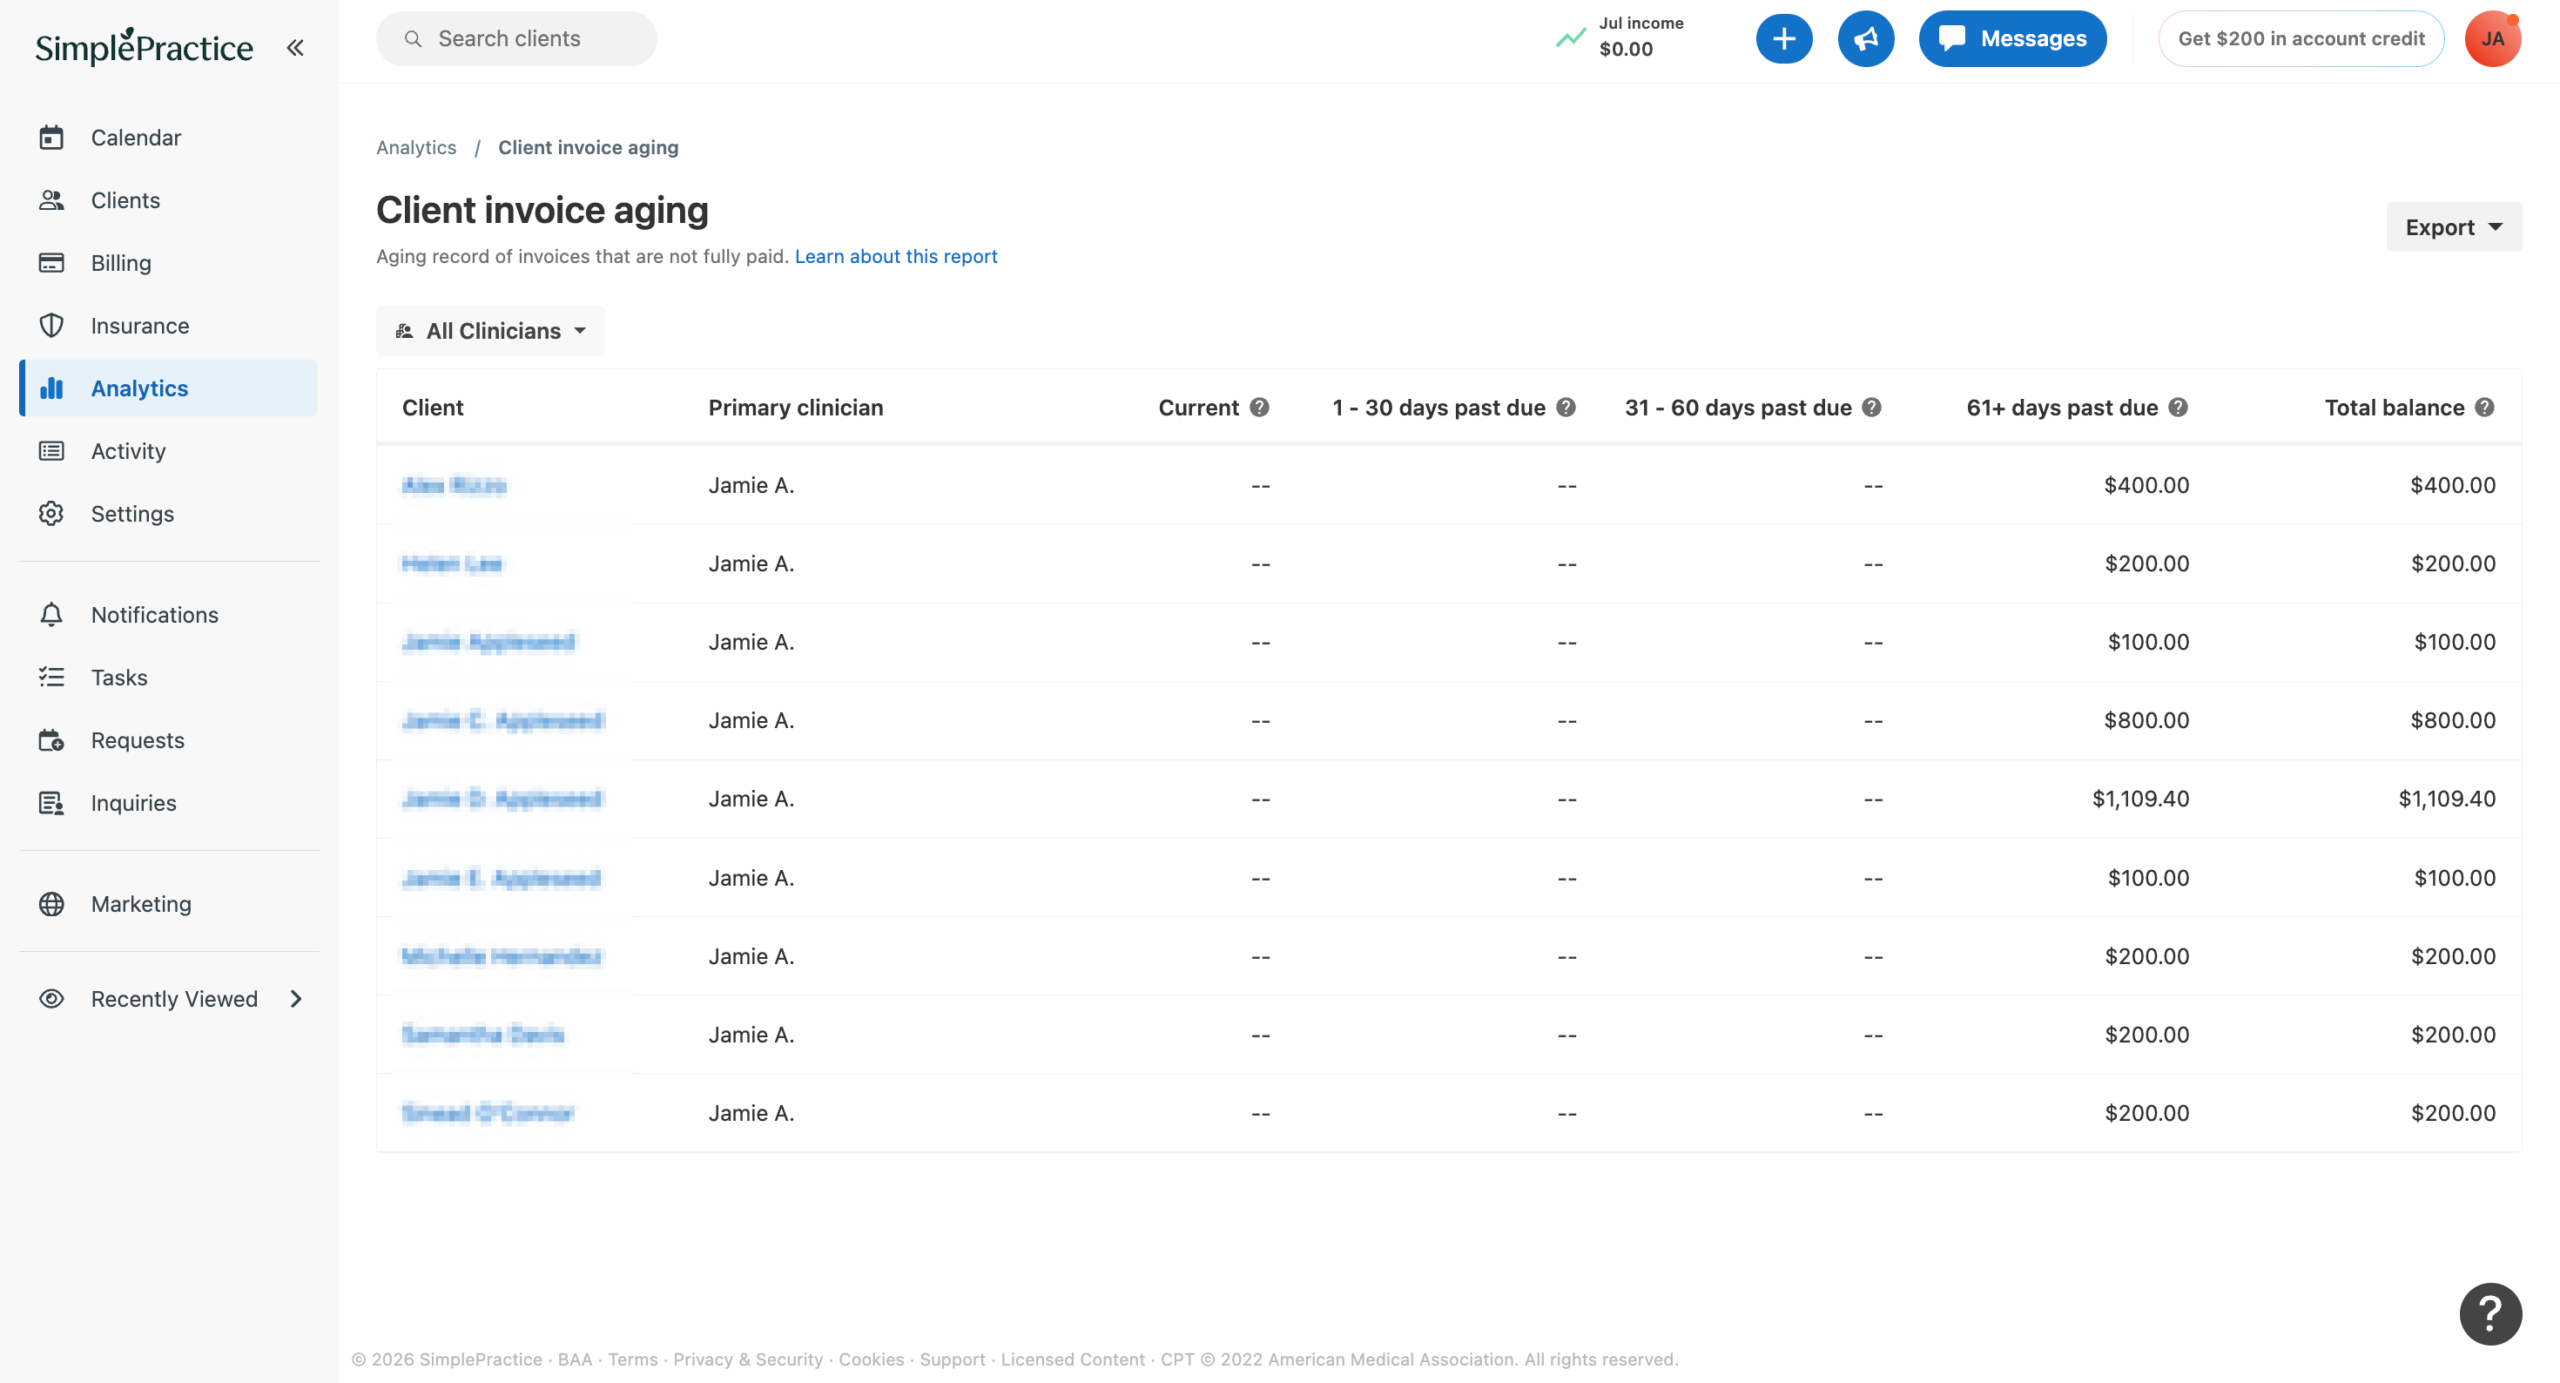
Insurance follow-up gets most of the attention in billing conversations. Client balances are often treated as an afterthought — and that’s where a lot of practices quietly lose money.
A client who owes a $30 copay from six months ago is easy to overlook when you’re focused on a $400 insurance claim denial. But 20 clients each carrying a $30 balance is $600 sitting uncollected. And balances that aren’t addressed promptly tend to grow, not shrink.
What This Report Shows
- Open balances from copays not collected at the time of service
- Deductible amounts applied by insurance and passed to the client
- Coinsurance balances after insurance has paid its portion
- Self-pay invoices that haven’t been paid
- Balances from clients who may have ended treatment without a final payment
What to Actually Look For
Sort by balance age, not balance amount. A $20 balance from eight months ago is harder to collect than a $200 balance from last month. The older a client balance gets, the less likely it is to be paid — and the more awkward the conversation becomes if the client has since ended treatment.
Look for clients with balances that have grown over multiple months without a statement going out or a payment coming in. This usually means statements either aren’t being sent or the client has payment information on file that’s been ignored.
Also check whether clients have a card on file. A balance with no payment method on file and no recent payment activity is going to require a direct conversation — the sooner that happens, the easier it is.
⚠️ If the total outstanding client balance is growing month over month while your appointment volume is stable, either statements aren’t going out, payment methods aren’t being collected, or clients aren’t paying and no one is following up.
✔️ Send statements for any balance over $25 that is more than 30 days old. For balances over 60 days with no payment activity, a direct conversation at the next appointment is often more effective than another statement.
For in-network clients, most payer contracts require you to collect applicable cost-sharing. Routinely waiving copays or failing to collect balances can be a compliance issue under some agreements. Having a clear written financial policy that clients sign at intake makes these conversations significantly easier.
Report 4: Payment Report — Review weekly
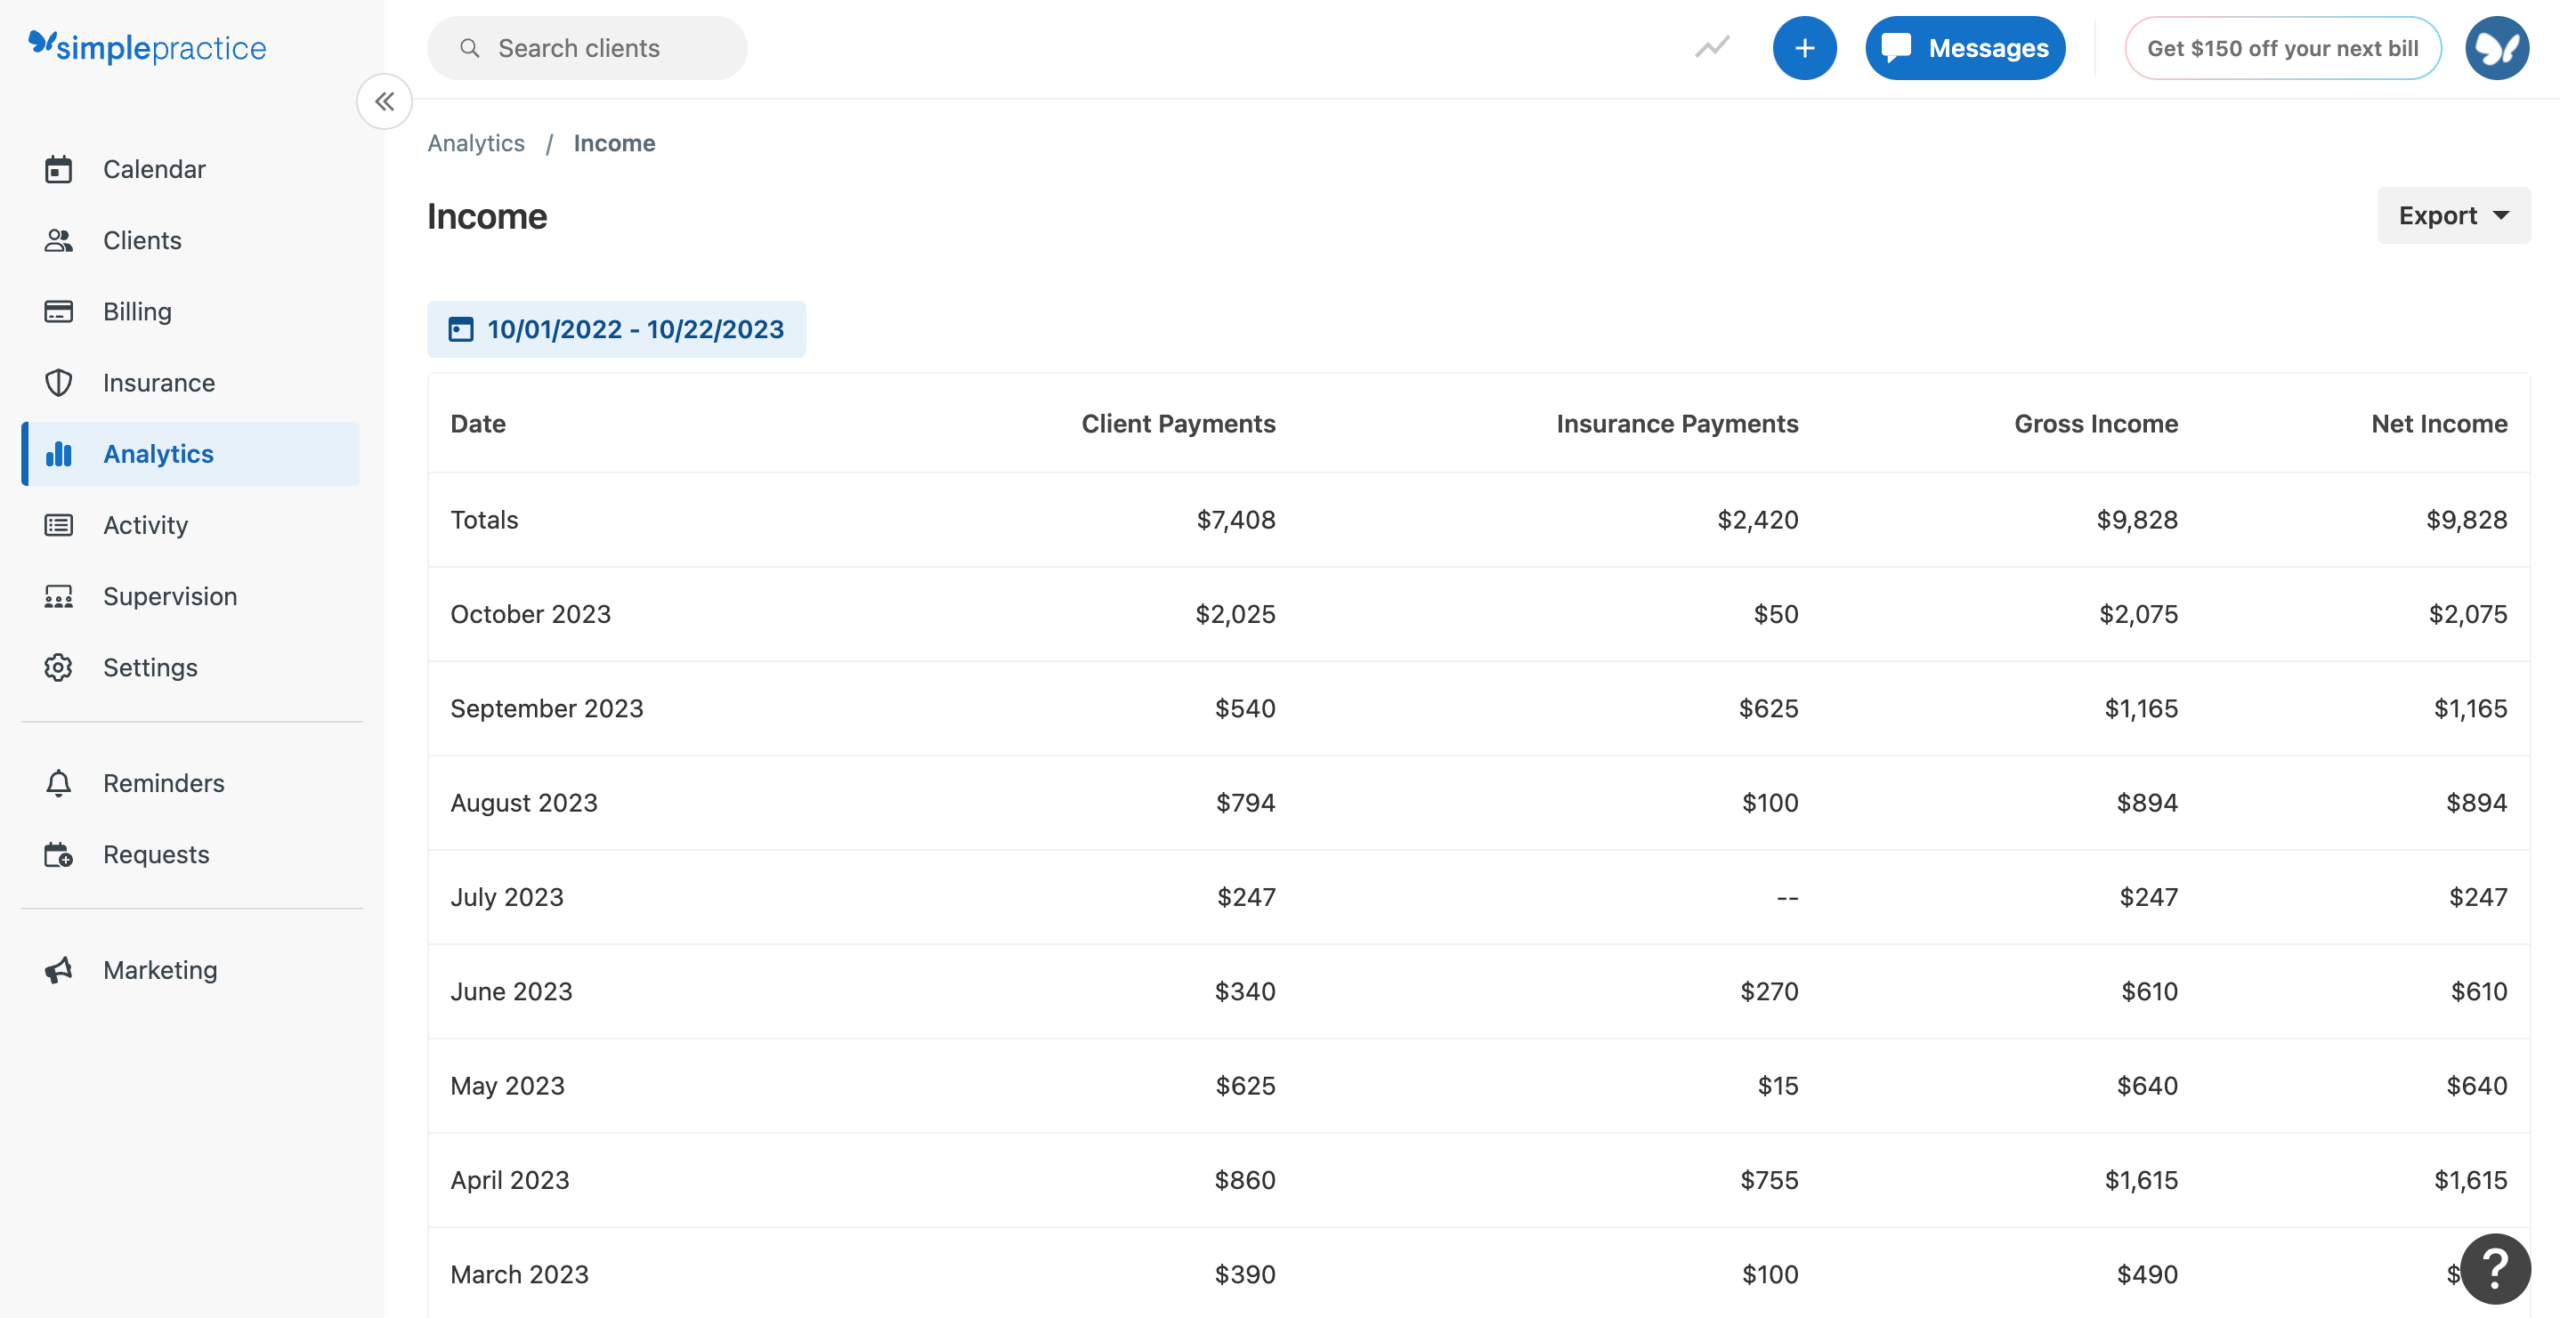
The payment report, also known as Income Allocation report, shows you every payment received over a given period — from insurance companies, from clients, and any adjustments or refunds. Think of it as your practice’s income ledger. It answers not just how much came in, but where it came from and whether anything looks off.
What to Look For Week to Week
- Total insurance payments vs. the prior week — is revenue consistent or dropping?
- Client payment totals — are clients paying at the time of service or carrying balances?
- Refunds or negative adjustments — any overpayments being returned?
- Unusual adjustments — write-offs that weren’t authorized, or corrections that don’t match a known denial
- Payments that don’t correspond to any claim you remember submitting — rare, but worth confirming
Understanding Contractual Adjustments
When you post an insurance payment, you’ll typically see three numbers: the amount billed, the amount allowed under the contract, and the amount paid. The difference between your billed amount and the allowed amount is the contractual adjustment — the discount you agreed to as an in-network provider. This is not lost revenue; it’s the expected write-off built into being in-network.
What you’re watching for is underpayments relative to the contracted rate — when the amount paid is less than the allowed amount without a clear explanation. If an insurance company consistently pays below your contracted rate, that’s a payer contract issue worth investigating.
Using Payment Trends Over Time
Week-to-week payment totals will fluctuate with your appointment volume, holidays, and payer processing cycles. What’s more meaningful is comparing month-over-month payment totals at the same appointment volume. If you’re seeing the same number of clients but collecting less, something in the billing process has changed.
⚠️ A sudden drop in payments without a corresponding drop in appointments is a signal. Check whether claims are being submitted consistently, whether a payer’s processing has slowed, or whether denials have spiked.
✔️ If you notice a payer is consistently slower than others, adjust your follow-up timing accordingly. Some payers routinely take 45 days; others process in 10. Knowing the difference helps you prioritize follow-up correctly.
Report 5: Appointment Status Report — Review monthly (flag weekly anomalies)
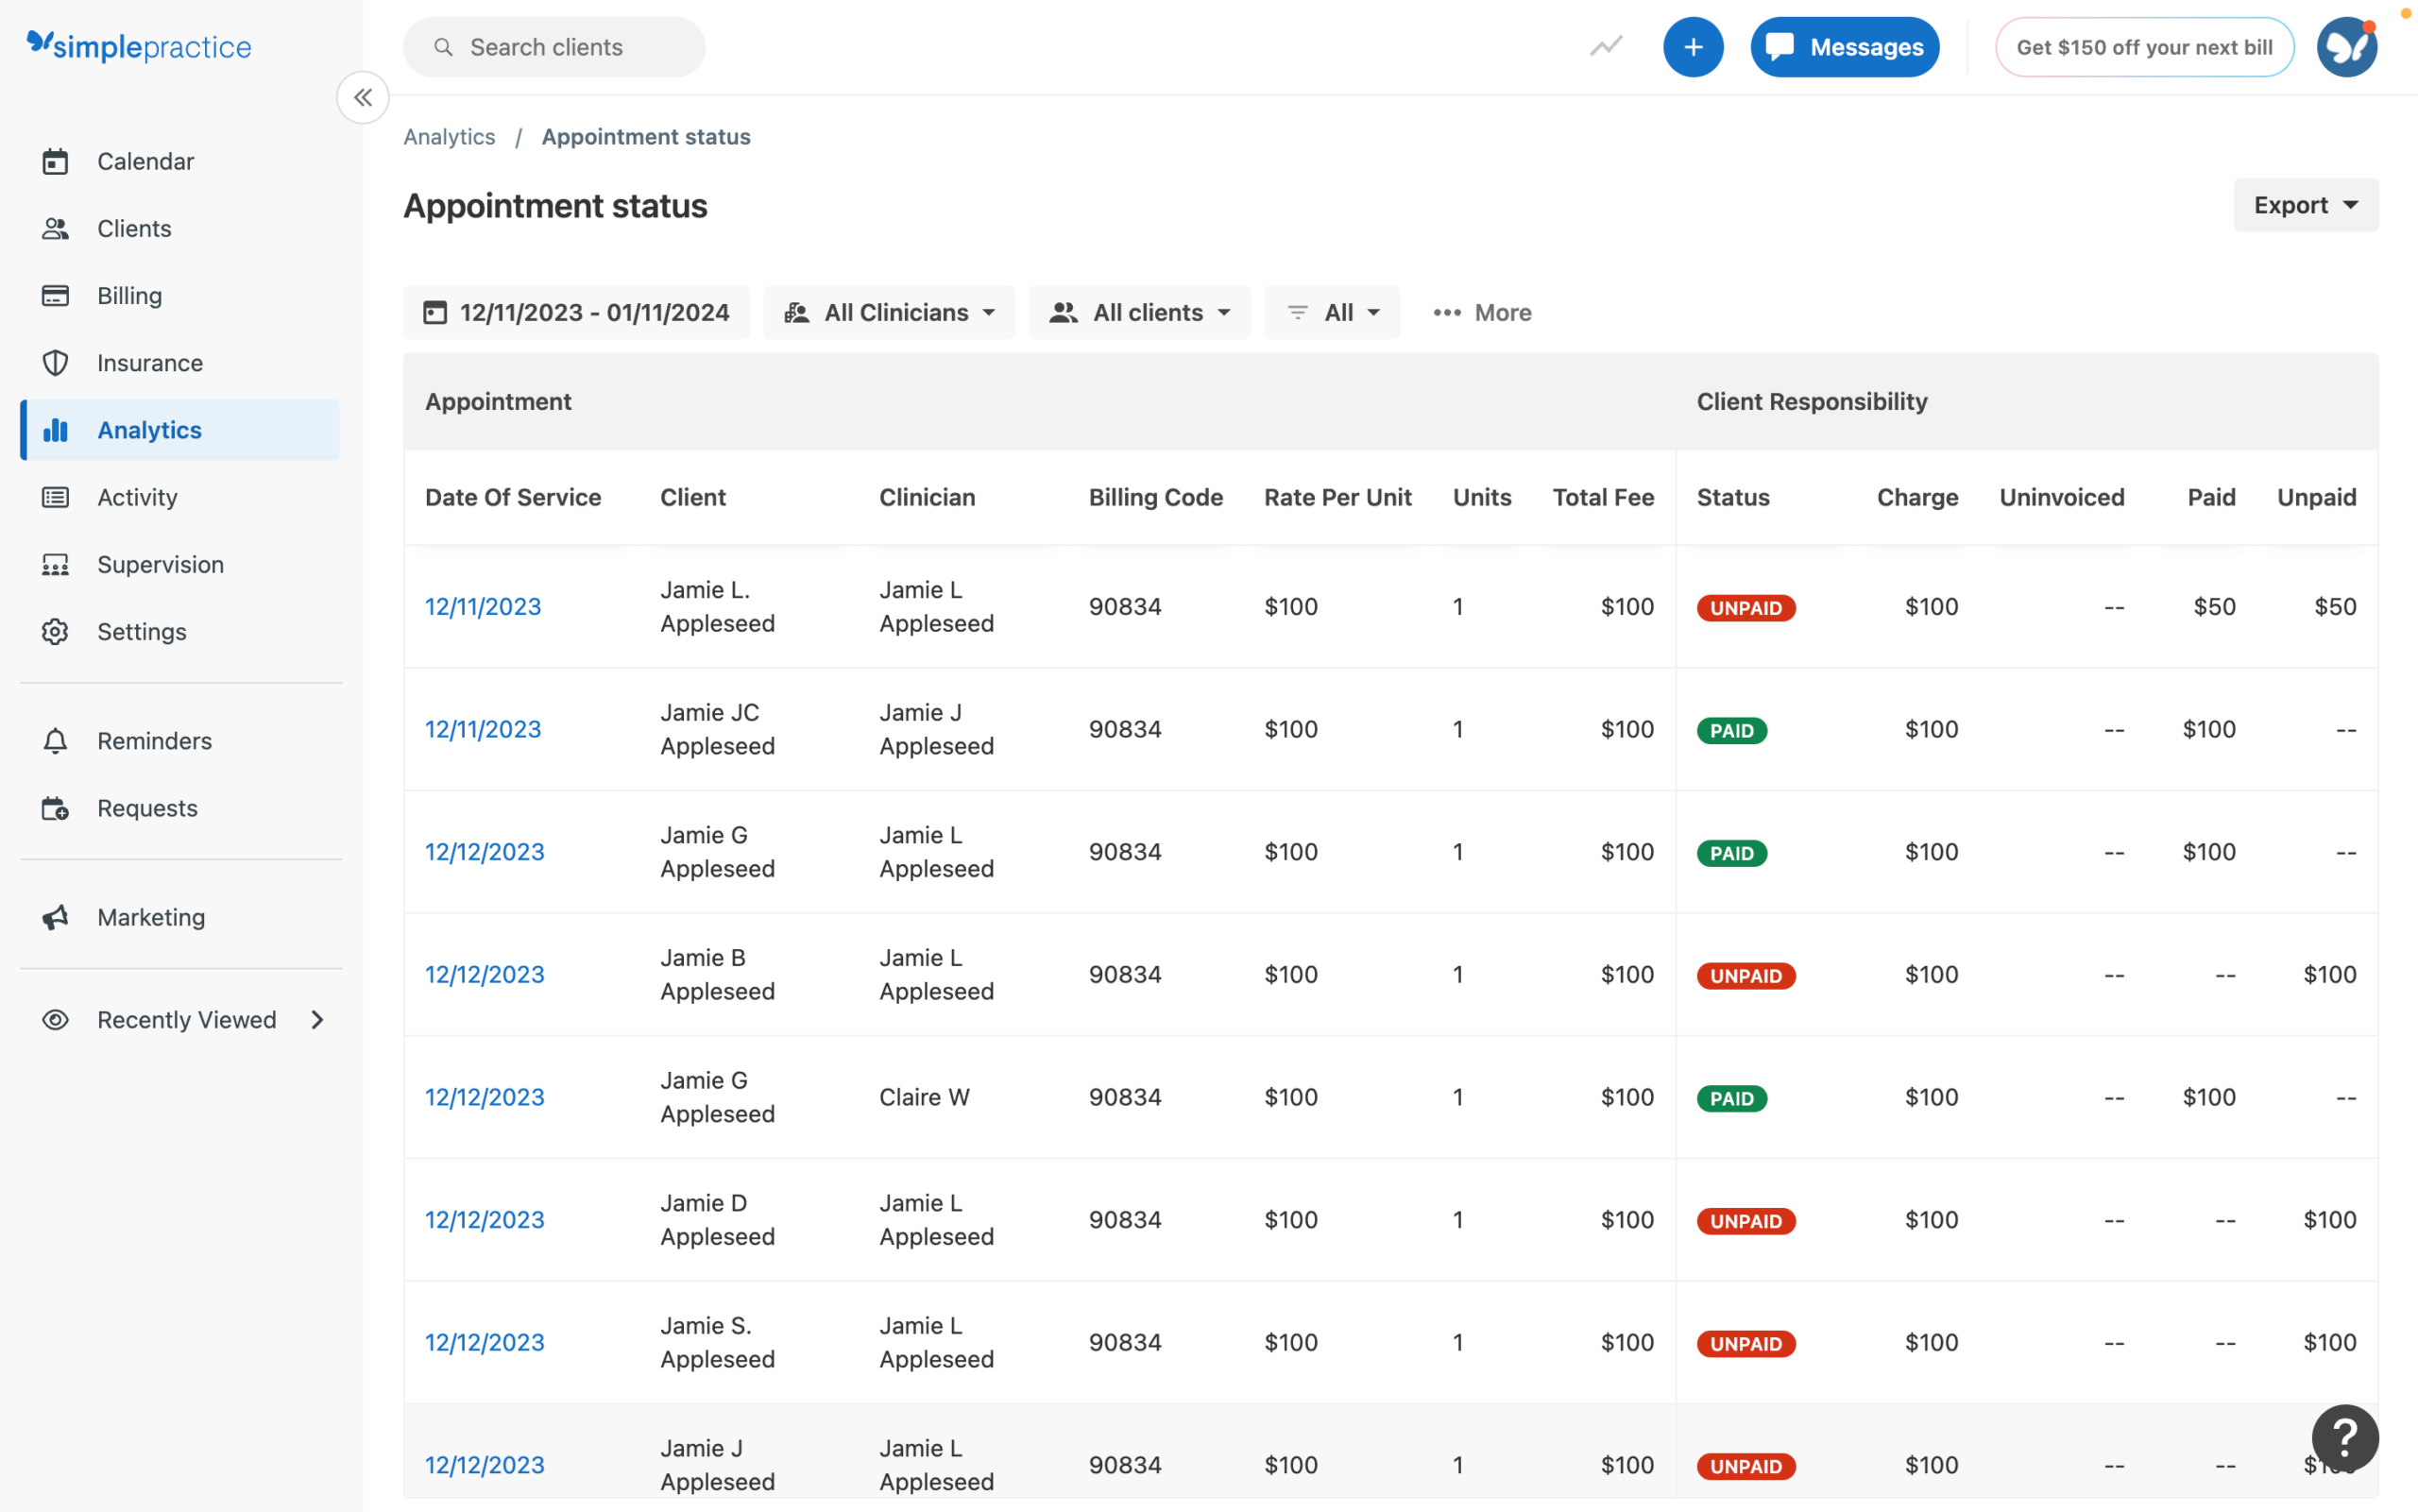
The appointment report is primarily a scheduling tool, but it has direct financial implications that are easy to overlook. Appointment volume drives revenue volume — and patterns in your scheduling data can tell you things your payment report won’t.
The Financial Side of Appointment Data
- No-show and late cancellation rates — every missed session is lost revenue. A $150 session that doesn’t happen costs the practice $150, regardless of how full the calendar looks.
- Appointment volume week over week — if you’re seeing fewer clients, revenue will follow. Catching a volume decline early lets you respond to it.
- Completed vs. scheduled appointments — the gap between these two numbers represents your no-show and cancellation impact
- Telehealth vs. in-person ratios — matters for billing if telehealth modifiers or different payer policies apply
No-Show Rate: What’s Worth Watching
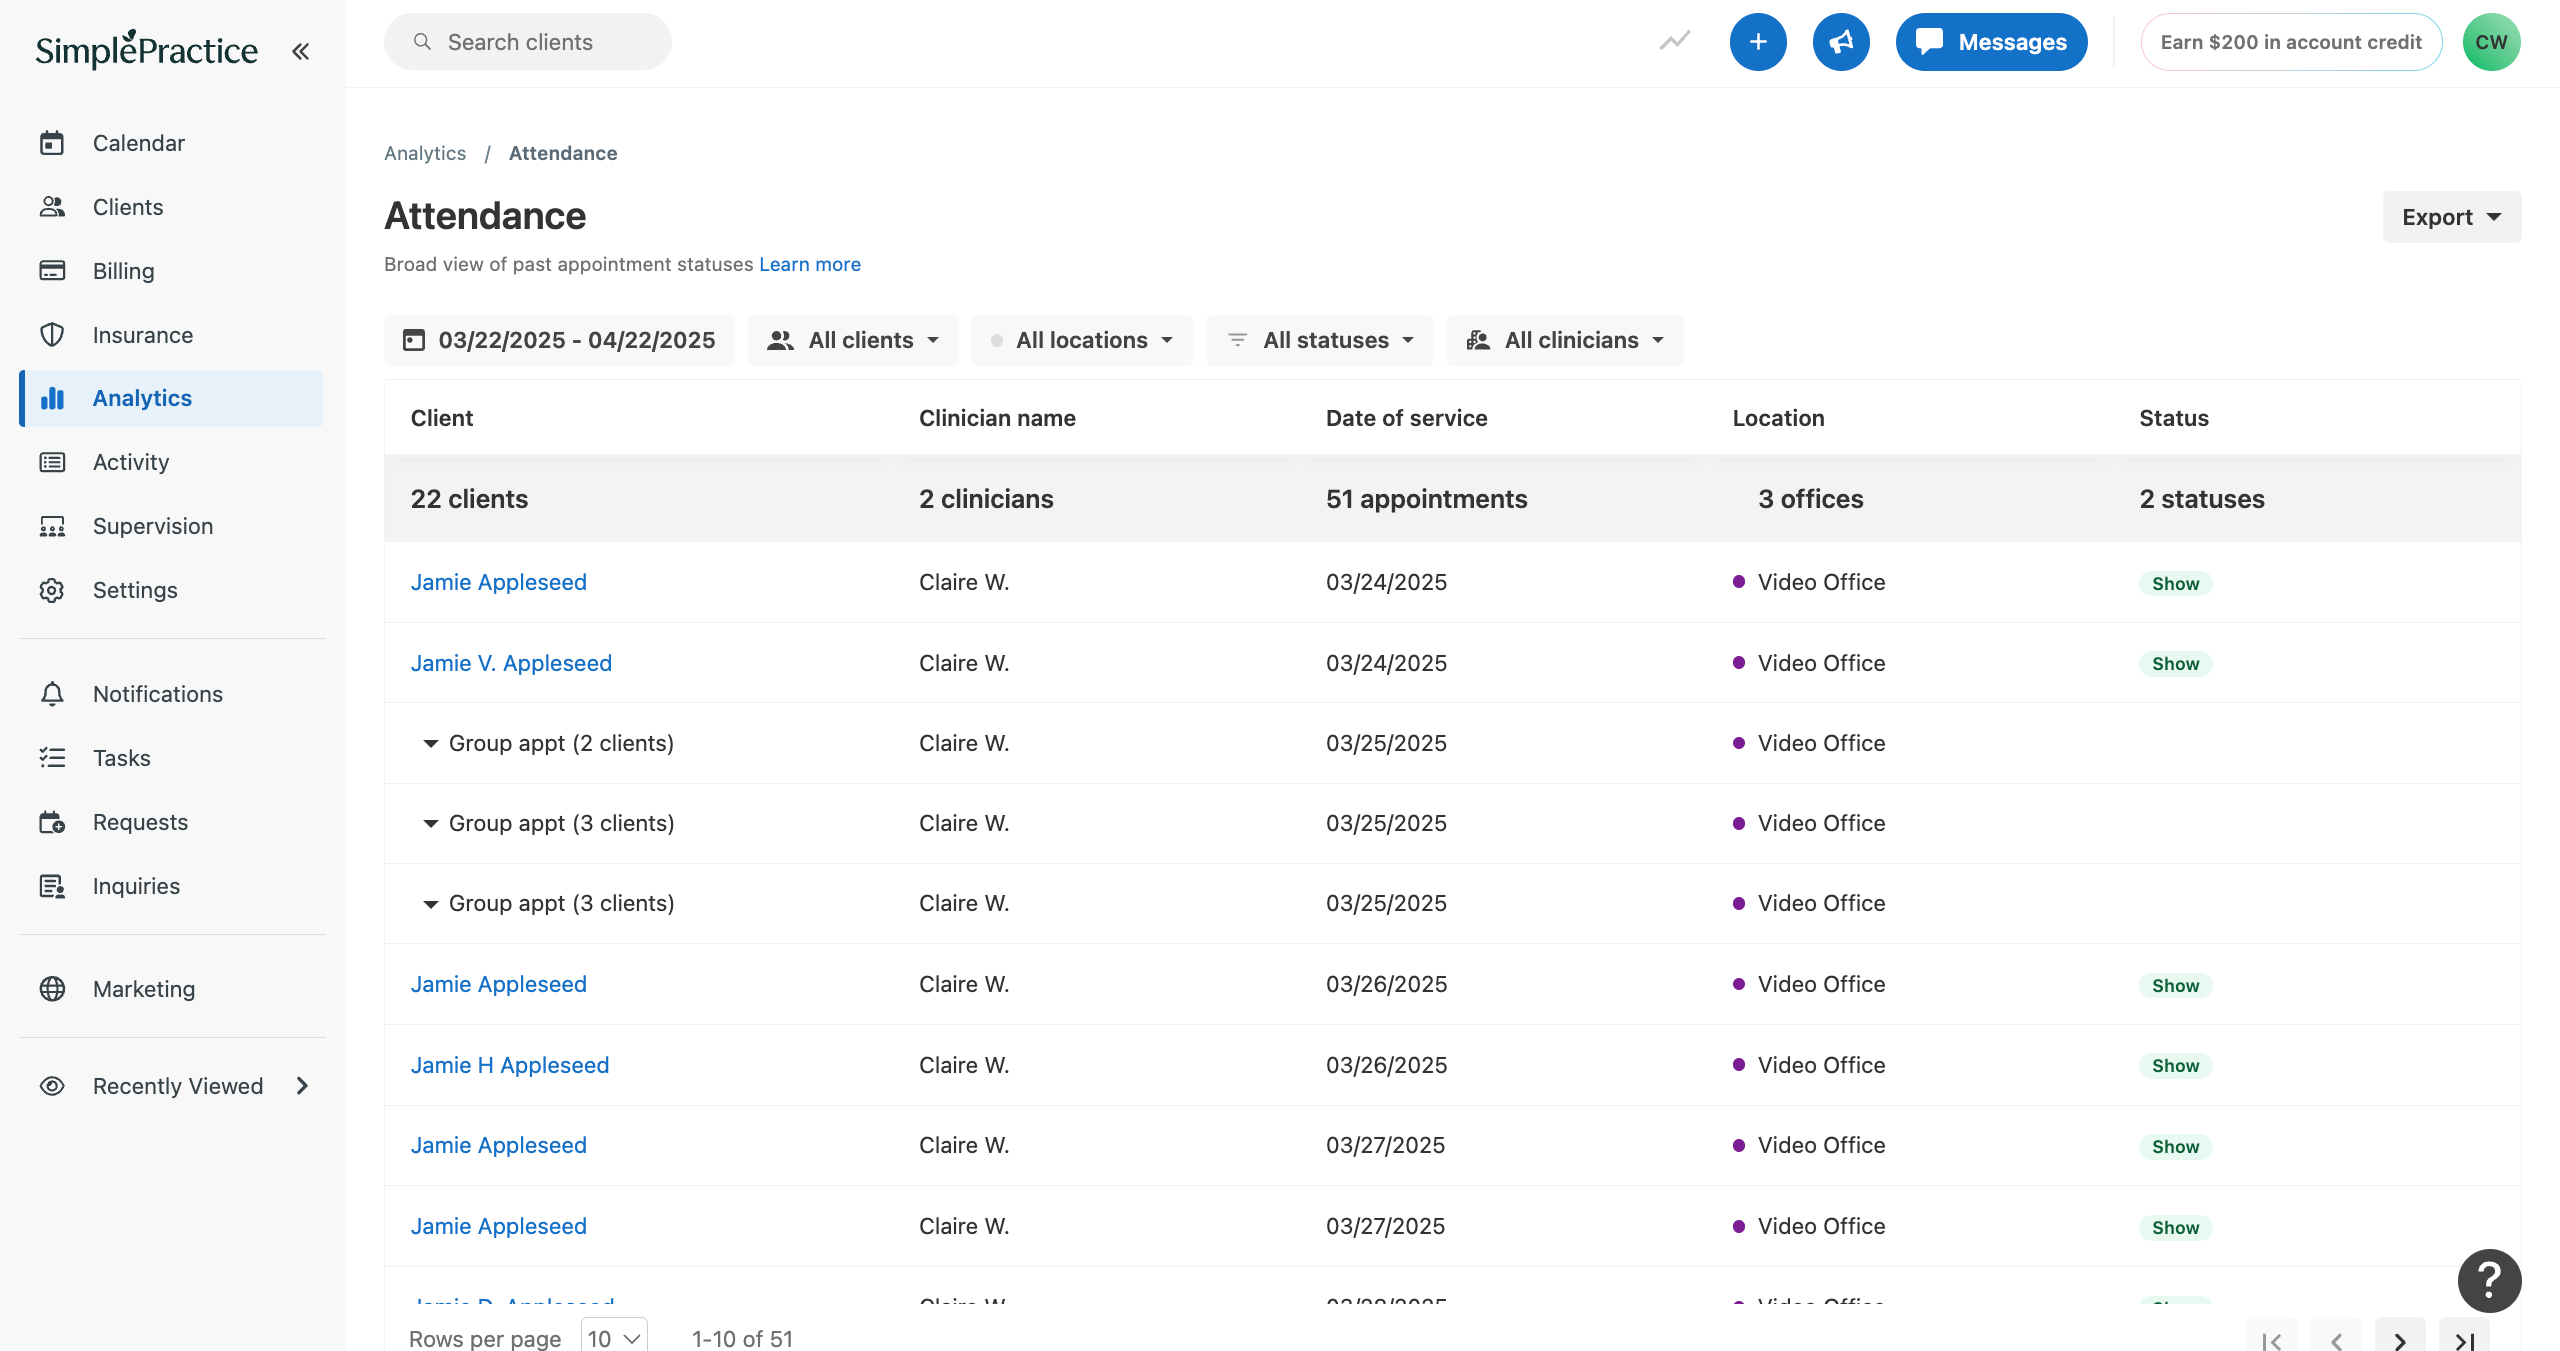
You can also view the attendance record of individual clients.
An occasional no-show is normal. A no-show rate that’s consistently above 10 to 15 percent is a practice management issue that’s costing real money. At 20 clients a week, a 15 percent no-show rate is three missed sessions — which could represent $300 to $600 in lost billable time weekly.
The appointment report helps you see whether no-show rates are concentrated with specific clients, specific days, or specific insurance types. That kind of pattern matters for your scheduling and reminder strategy.
⚠️ If your no-show rate starts climbing, check whether appointment reminders are going out correctly. SimplePractice’s automated reminder system is only as effective as its configuration. Verify reminder timing and delivery methods for the clients with the highest no-show rates.
✔️ If late cancellations are frequent, revisit your cancellation policy and make sure clients have signed a copy. A clear, consistently enforced policy is the most effective tool for reducing last-minute cancellations.
Report 6: Insurance Payment Summary — Review monthly
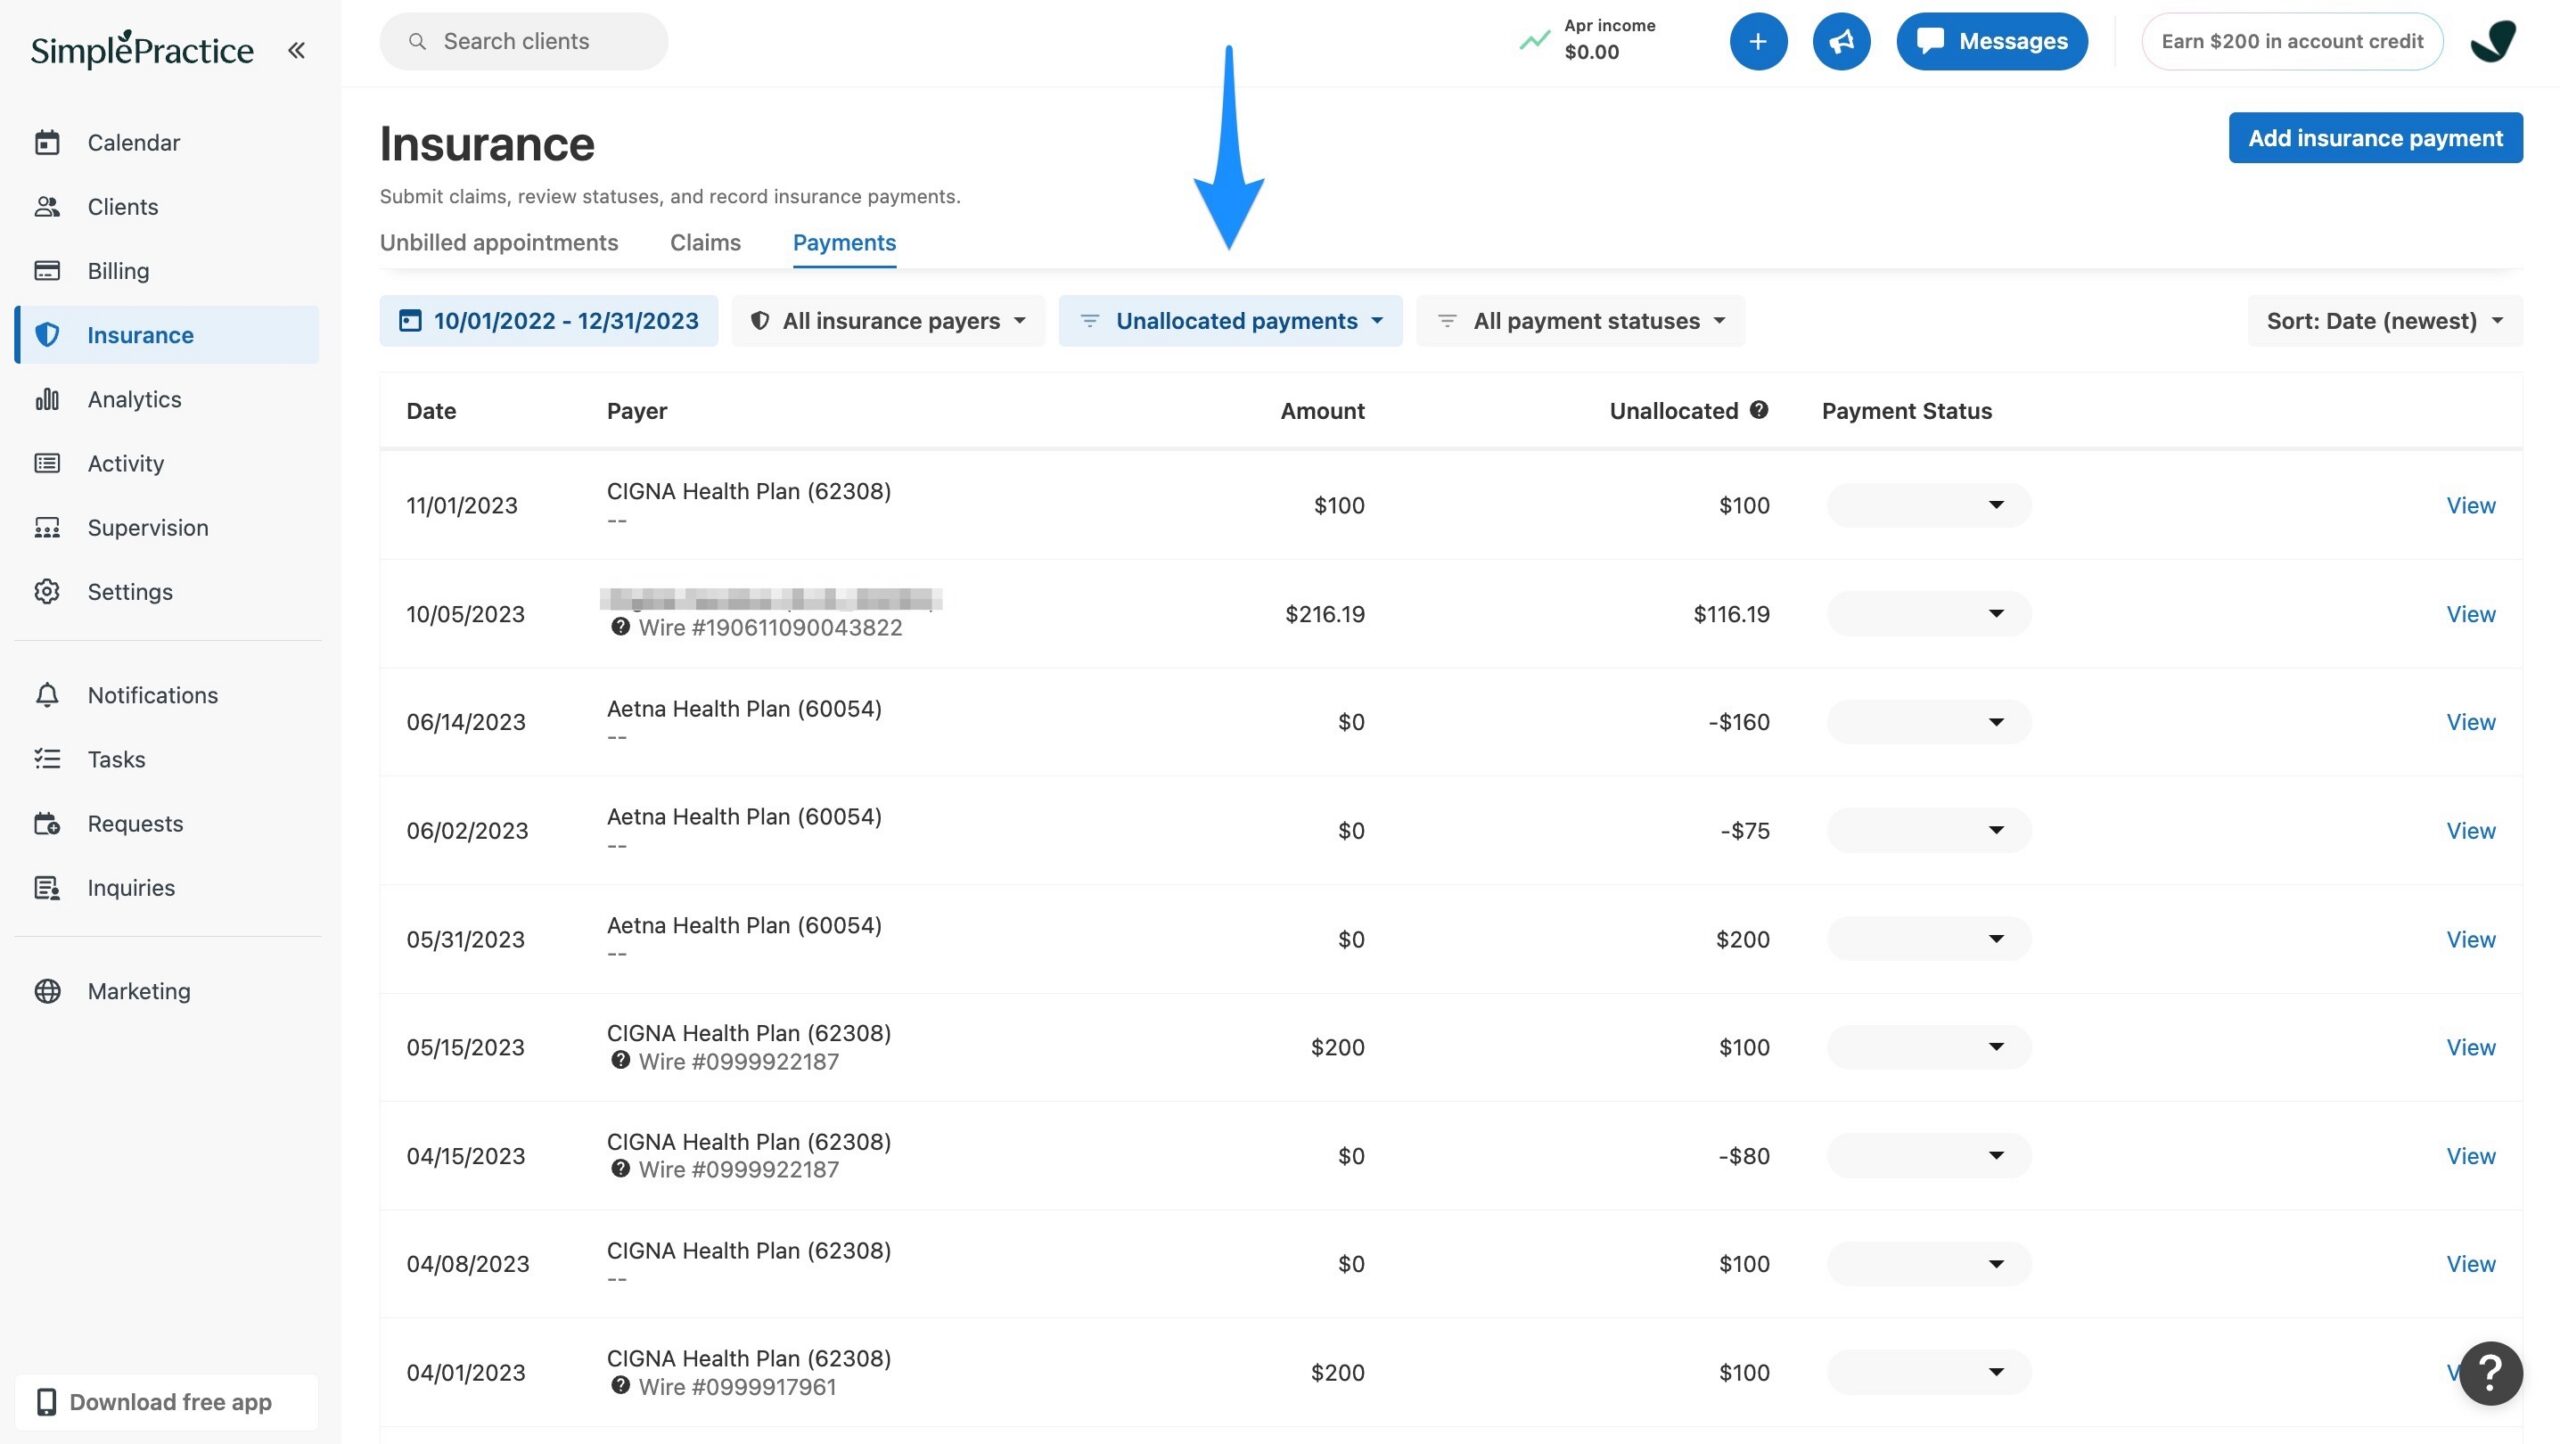
This report shows your payment totals broken down by payer. It will show you the date of payment, payer, amount and if there’s any unallocated payments.
What to Analyze
- Look for unallocated payments. This is money that was paid to you but not applied to a specific claim. A negative number here could mean a clawback that needs investigated. A positive number may mean you need to apply the outstanding amount to the specific claim. Sometimes there’s a hiccup. Or maybe a claim was accidentally deleted.
- Open the individual payment and check was you billed insurance against what was paid. Was it calculated correctly? Is the write-off correct? Compare these numbers to your contracted rates to make sure you are getting paid correctly.
- If there’s no write-off amount, are you charging enough? Insurance is never going to pay you more than you bill. Make sure you aren’t underbilling.
Using This Data for Practice Decisions
Therapists often join insurance panels without a clear sense of which ones will be worth the administrative burden. This report gives you the data to evaluate that over time.
A payer that pays well per session but generates frequent denials and slow processing may actually cost more in administrative time than a payer with slightly lower reimbursement but clean claims processing. That tradeoff isn’t visible in any single claim — but it shows up clearly in the Insurance Payment Summary over several months.
This report is also useful for identifying reimbursement rate issues. If a payer’s average payment per claim starts declining without any change in your billing practices or coding, that’s worth investigating. It could indicate a fee schedule change, a processing change, or underpayments that have been slipping through.
⚠️ If one payer represents a disproportionate share of your revenue, that’s a concentration risk worth being aware of. Changes to that payer’s reimbursement rates or panel policies have an outsized impact on your practice.
✔️ Pull this report quarterly with a one-year lookback. Compare average reimbursement per CPT code by payer. If any payer is consistently below your contracted rate, contact their provider relations department.
Report 7: Monthly Revenue Trends — Review monthly
Individual weekly payment reports tell you what happened this week. Monthly revenue trend data tells you whether your practice is growing, stable, or declining — and gives you enough context to make actual business decisions.
What to Compare
- Month-over-month collections — is revenue growing, flat, or declining?
- Same month, prior year — helpful for separating seasonal patterns from actual trends
- Revenue relative to appointment volume — if you’re seeing the same number of clients but collecting less per session, something in the billing pipeline has changed
- Average collection per completed session — a declining number here often means either payer rates have changed or write-offs have increased
Why This View Matters
Monthly trends reveal things that weekly data hides. A slow week in December looks alarming in isolation. In the context of the prior two years, it’s a normal seasonal pattern. Conversely, a gradual revenue decline over six months — the kind that’s easy to attribute to “a slow month” repeatedly — becomes obvious when you’re looking at a full-year trend line.
The most useful question this report can help you answer: is my revenue keeping pace with my caseload? If appointment volume is growing but revenue isn’t, claims are either being denied, delayed, or not submitted. If revenue is growing faster than appointments, your payer mix or reimbursement rates have improved. Either scenario tells you something important.
If revenue has been flat or declining for three or more consecutive months while appointment volume is stable, don’t attribute it to a slow season without checking your claims first. Flat revenue at steady volume almost always indicates a billing process problem.
Build a simple tracking spreadsheet outside of SimplePractice if you want trend visibility that spans more than one fiscal year. SimplePractice’s built-in reporting is strong for current-period analysis; a running monthly spreadsheet gives you a multi-year perspective.
How to Export and Share These Reports
Reviewing reports yourself is one thing. Getting them in front of a bookkeeper, CPA, or biller without a back-and-forth is another — and it’s a step a lot of solo practices never formalize.
A few habits that make this easier:
- Export on a consistent schedule, not on request. If your bookkeeper needs the Payment Report and A/R Report monthly, export both at the same time each month — right after your monthly review — rather than waiting to be asked.
- Keep a shared folder, not email attachments. A single shared drive folder (Google Drive or similar) organized by month avoids the version-control mess of emailing spreadsheets back and forth — and it’s easier to keep HIPAA-conscious, since you control access in one place rather than scattered across inboxes.
- Give context, not just the file. A one-line note — “A/R over 90 days is flagged in yellow, still working two of them” — saves your bookkeeper or biller from re-deriving what you already know.
- If you outsource billing, agree upfront on which reports they need and how often. This is one of the most common gaps I see when practices outsource their billing: the practice keeps reviewing reports on their own schedule, and the biller is working from a different one. Align the two.
Alternatively, you can give your biller or bookkeeper access to SimplePractice with their own login. SimplePractice offers the following administrative roles, each comes with its own permission level:
- Practice manager
- Practice biller
- Practice scheduler
Only Practice Managers have access to clinic financial dashboards and reports.
Recommended Report Review Schedule
You don’t need to review every report every day. What matters is consistency. Here’s the schedule I’d recommend for a solo practice managing its own billing.
| Frequency | Reports to Review | What You’re Looking For |
| Weekly (20–30 min) | Insurance Claims Report, Accounts Receivable Outstanding Client Balances, Payment Report | Claims that need follow-up. Balances aging past 30 days. Revenue that didn’t arrive as expected. Anything that needs action this week. |
| Monthly (30–45 min) | Appointment Report, Insurance Payment Summary, Monthly Revenue Trends | No-show patterns. Payer performance comparison. Revenue trajectory vs. prior months and same period last year. |
| Quarterly | Insurance Payment Summary (extended view), Monthly Revenue Trends (full year) | Reimbursement rate changes. Panel profitability evaluation. Year-over-year revenue comparison. |
The Weekly Financial Check-In
If you’re managing your own billing, this is the routine I’d recommend. It’s not comprehensive — it’s the minimum consistent practice that prevents most revenue leakage.
Step 1: Insurance Claims
Pull the Insurance Claims Report filtered to open or unresolved claims. Review anything over 30 days. For each claim over 60 days, check payer portal status or note a follow-up call. For denied claims, note the denial reason and what the next step is. Create a short list of actions: claims to resubmit, calls to make, appeals to file.
Step 2: Accounts Receivable
Filter the A/R report to show balances over 30 days. Note anything new that has crossed into the 60-day bucket. Flag anything in the 90+ day bucket for immediate follow-up. The goal is to make sure nothing is aging without anyone noticing.
Step 3: Client Balances
Check for balances over $25 that are more than 30 days old. Confirm statements are going out. For balances over 60 days with no recent payment activity, flag for a conversation at the next appointment.
Step 4: Payments
Scan the week’s payment report. Confirm everything looks roughly consistent with your appointment volume. Flag anything unusual — a payment that seems too low, an unexpected adjustment, or a missing payment from a payer who typically pays quickly.
The goal of this check-in isn’t to resolve everything in 20 minutes. It’s to create a short list of follow-up items so nothing falls through the cracks. Consistency matters far more than comprehensiveness.
Get the Printable Checklist
Want this as a printable checklist? Grab the Monday Morning Billing Route — a similar routine to that above, in a one-page printable you can run through every Monday.
Red Flags That Deserve Immediate Attention
Certain patterns in these reports signal a problem that won’t resolve on its own.
- Claims aging past 60 days without a status update — call the payer. Don’t assume they’re processing.
- A spike in denials from one payer in a short period — investigate the root cause before resubmitting individually. A pattern usually means a systemic issue.
- Client balances growing month over month at steady appointment volume — statements aren’t going out, or clients aren’t paying and no one is following up.
- Revenue declining at steady or growing appointment volume — claims aren’t being submitted, are being denied at higher rates, or are sitting unworked.
- No-show rate climbing above 15 percent — check reminder delivery, revisit cancellation policy.
- The 90+ day A/R bucket growing — this is the clearest signal of a revenue cycle problem. It requires active follow-up, not monitoring.
- Payments from a specific payer suddenly slower than usual — may indicate a processing change, a credentialing issue, or a payer-side problem worth calling about.
Frequently Asked Questions
How often should I review SimplePractice reports?
At minimum, the four core billing reports (Insurance Claims, A/R, Client Balances, Payments) should be reviewed weekly. The appointment, payer summary, and revenue trend reports are best reviewed monthly. Weekly consistency is more valuable than occasional comprehensive reviews.
Which report is the most important?
The Insurance Claims Report and A/R Report together give you the clearest picture of your revenue cycle health. If you only have time for two reports, those are the ones. The Insurance Claims Report tells you what’s unresolved and needs action; the A/R Report tells you how long things have been unresolved.
What’s a healthy accounts receivable for a solo practice?
There’s no universal benchmark, but most billing professionals aim to keep the majority of the A/R balance in the 0–30 day bucket, with minimal amounts in the 60+ day range. If more than 20 to 25 percent of your total A/R is over 60 days old, the revenue cycle needs attention. The 90+ and 120+ day buckets should be small and actively worked, not quietly accumulating.
Should I track insurance and client balances separately?
Yes. Insurance balances and client balances require completely different follow-up strategies. Insurance follow-up involves calling payer provider services, checking claim status, filing appeals, and correcting and resubmitting claims. Client balance follow-up involves statements, payment conversations, and sometimes payment plans. Tracking them separately makes it much easier to manage each type effectively.
Can the Insurance Payment Summary help me decide which panels to leave?
Yes, and that’s one of the best uses of this report. If a payer consistently generates high denial rates, slow payment, and below-average reimbursement relative to the administrative work involved, that’s a data-supported reason to reconsider your participation. Most therapists make panel decisions based on gut feeling; the payment summary gives you actual numbers.
What if I notice claims stuck in ‘submitted’ for weeks?
Don’t wait. Check the payer portal for claim status. If it doesn’t appear in the portal, it may not have been received — call provider services and ask. If the claim was received, ask for the expected processing timeline and document the response. A claim stuck in “submitted” for more than three weeks without any payer acknowledgment often means something went wrong with transmission.
I’m not a numbers person. How do I make this less overwhelming?
Start with one report: the Insurance Claims Report. Look at it every Monday for four weeks. You’ll quickly develop an instinct for what looks normal and what doesn’t. Once that’s a habit, add the A/R report. Build from there. You don’t need to understand everything at once. Consistent attention to a small number of reports beats occasional deep dives every time.
Can these reports help me catch billing errors?
Absolutely. Repeated denials from one payer for the same reason often point to a setup error — a modifier that’s not being added automatically, a place of service code that’s wrong for telehealth, an NPI configuration issue. Underpayments visible in the payment report can reveal a contracted rate discrepancy. The reports don’t just show you what’s happened — they show you patterns that indicate something in the billing process needs to change.
Final Thoughts
SimplePractice gives you the reporting infrastructure most solo practices need to manage their revenue cycle effectively. The tools are there. The gap is usually in reviewing them consistently enough to catch problems while they’re still manageable.
The practices I’ve worked with that stay on top of their billing aren’t doing anything complicated. They’re looking at the same handful of reports every week, creating a short follow-up list, and actually working through it before the next week starts. That consistency — more than any single action — is what keeps the revenue cycle healthy.
If you’re currently not reviewing reports regularly, start with the Insurance Claims Report this week. Just that one. Once it’s a habit, add the A/R report. A 20-minute review practice, consistently maintained, will surface and resolve more billing problems than any software feature or tool ever will.
→ Related: Mental Health Billing for Therapists: A Complete 101 Guide
→ Related: How to Appeal an Insurance Denial
→ Related: Bill Like a Boss Review
Build a documented billing system that helps your practice reduce claim denials, train staff faster, and protect your revenue—for less than the cost of a single billing mistake. Check out my SOP Toolkit.
